
What's New in Statistics for Data Analysis V.29
INDEX
-
What's new in Statistics for Data Analysis V.29
-
-
Alternatives OLS Linear
-
Parametric Accelerated Failure Time (AFT) models
-
Pseudo-R2 measurements in Linear Mixed Models and Generalized Linear Mixed Models
-
-
-
Workbook
-
Search
-
Dialog Box Functions
-
New Command syntax
-
Introduction
Statistics for Data Analysis powered by SPSS is a comprehensive solution that addresses all facets of the analytical process from data preparation and management to analysis and reporting.
Statistics for Data Analysis V29 introduces many new features, including a new overview tab in the Data Editor, OLS Regression, better integration with open-source extensions and other enhancements that have been designed to streamline your daily work.
What's New in Statistics for Data Analysis V.29
Data Editor
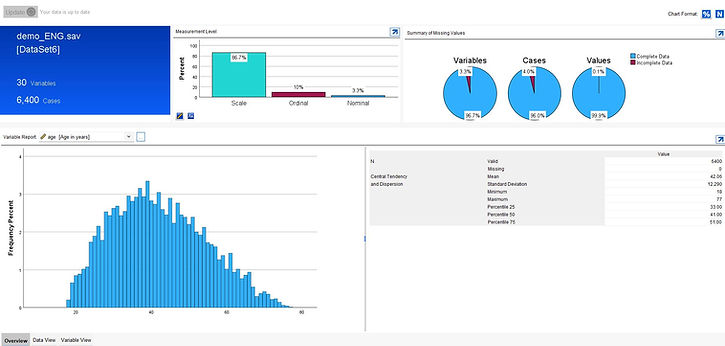
Near Data View and Variable View, a new Overview tab provides information on characteristics of the data in a dataset or file, with summaries of variable types, measurement levels, missing data, and allows drill down into individual variables with appropriate charts and summary statistics based on measurement level definitions.
Violin Plot
Violin plots have been added to the Graphboard Template Chooser. These plots are a hybrid of the box plots and kernel density plots. Violin plots show peaks in the data and are used to visualize the distribution of scale variables. Unlike a box plot that can only show summary statistics, violin plots depict summary statistics and the density of each variable.

New Analyze Procedures
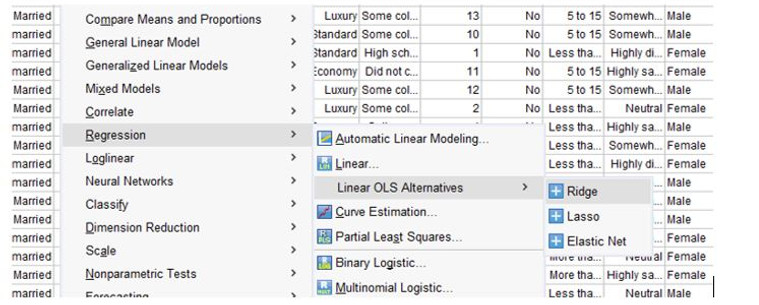
Linear OLS Alternatives: Lasso, Ridge and Elastic Net
The new 29 version of Statistics for Data Analysis powered by SPSS includes three new regression procedures that employ different forms of regularization: Lasso, Ridge e Elastic Net.
All of these techniques are optimised to prevent problems of over-fitting that are commonly associated with ordinary least squares regression. Generally speaking, these regularization techniques work by penalizing large model coefficients.
Lasso
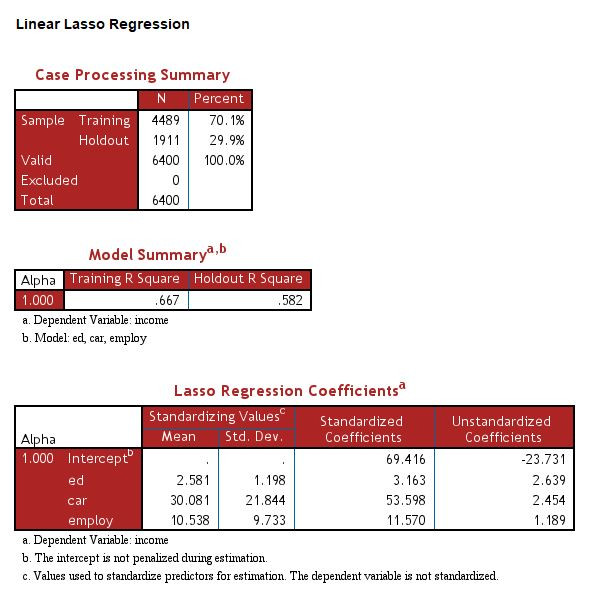
Often referred to as L1 regularization, the Lasso procedure (Least Absolute Shrinkage and Selection Operator) works by penalising the least important features, shrinking them towards zero. It is therefore useful for feature selection, as the weak variables are effectively nullified, thus simplifying the final model.
Ridge
L2 regularization, known as Ridge regression, tends to penalize coefficients in a more even manner than L1. As well as creating more generalisable models, it’s commonly employed when dealing with issues of multicollinearity.
Elastic Net
Elastic Net combines Lasso (L1) and Ridge regression (L2), which may result in a more balanced model if each individual method is in some way sub-optimal
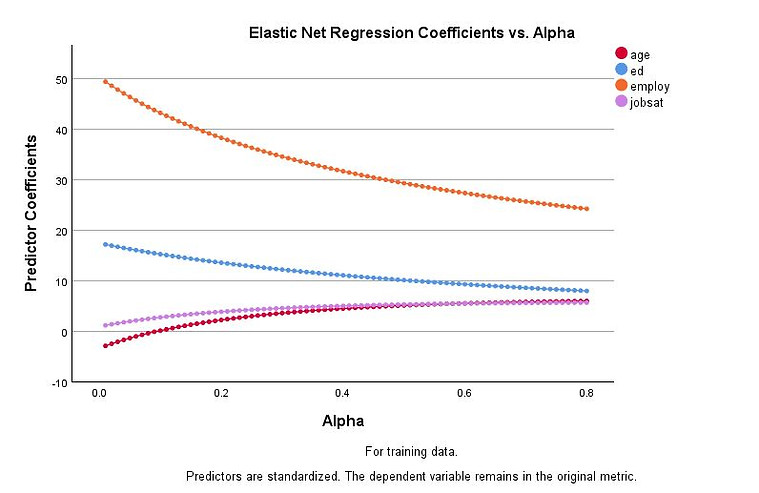
Trace plot output from the Elastic Net procedure showing the effect on model coefficients using different values of the Alpha hyperparameter.
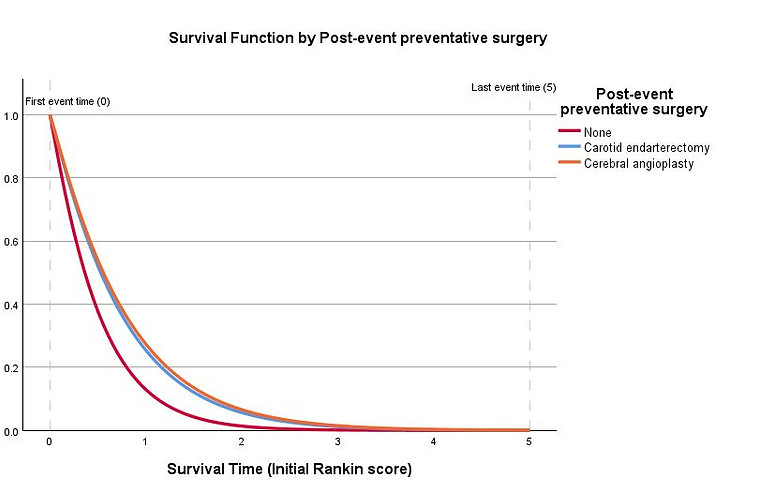
Parametric Accelerated Failure Time (AFT) Models
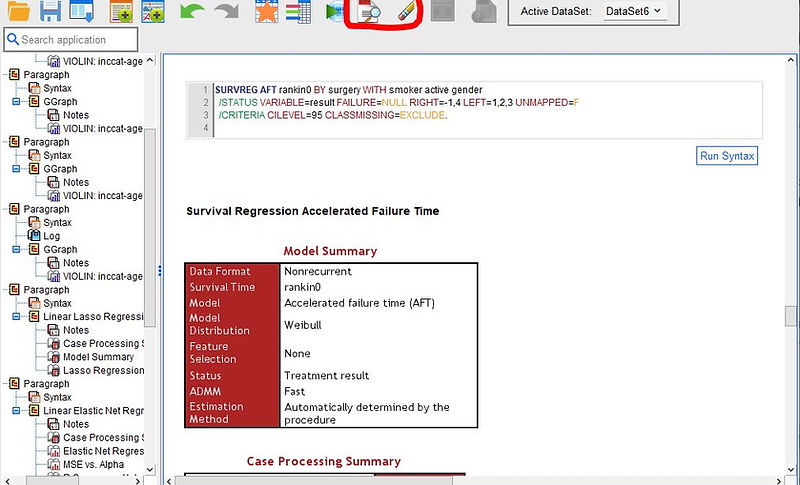
Statistics for Data Analysis V. 29 brings a new addition to the family of Survival analysis procedures. Unlike the existing Life Tables, Kaplan-Meier and Cox Regression procedures, the newly added Accelerated Failure Time Model is parametric in nature. This means it is assumed that the dependent variable follows a specific distribution. Parametric models are often regarded as less flexible than non-parametric models but if the outcome variable follows an identifiable distribution, these kinds of procedures can be very powerful. Whereas proportional hazards models assume that the effect of a covariate is to multiply the hazard by some constant, an AFT model assumes that the covariate effects accelerate or decelerate survival by some constant. This capability may be useful for researchers investigating time-to-failure as part of a preventive maintenance regime, especially when factors such as the location of a physical asset is known to accelerate or decelerate the time-to-failure.
This new procedure is in Statistics Advanced Modules.
Pseudo-R2 measures in Linear Mixed Models and Generalized Linear Mixed Models
The output from Linear Mixed Models and Generalized Linear Mixed Models includes pseudo-R2 measures and the intra-class correlation coefficient. R2 is a commonly reported fit statistic indicating the proportion of variance explained by a linear model. The intra-class correlation coefficient (ICC) is a related statistic that indicates how much variance is explained by a grouping (random) factor in multilevel/ hierarchical data.
Enhancements
Statistics for Data Analysis V. 29 also introduces several improvements that semplifies the daily work. These improvements concern both the menus and some dialog boxes, as well as an enhancement of the syntax commands.
Workbook
Two new toolbar buttons have been added in the Workbook: Show/Hide all syntax windows and Clear all output. Also, a new button has been added to the Status bar that enables users to quickly switch between Classic mode (Output and Syntax windows separate) and Workbook mode.
Search
The Search feature provides options for entering terms directly into a toolbar allowing users to view search results in a drop-down pane.

Dialog Box Functions
Percentiles
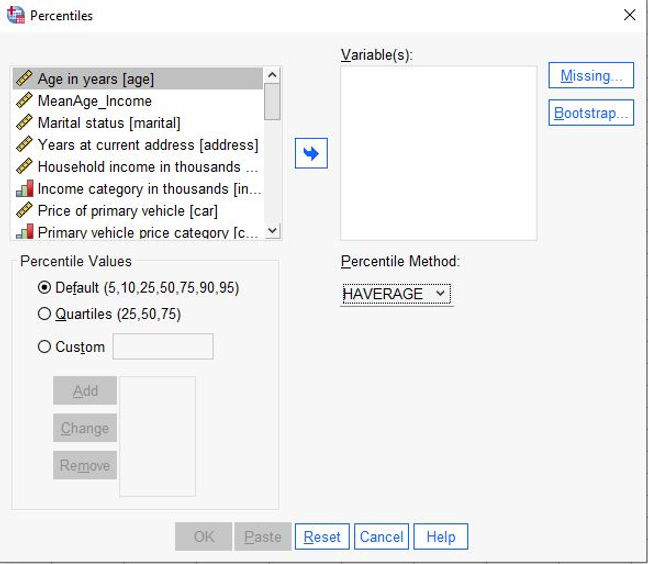
A new Percentiles dialog box (Analyze/ Descriptive Statistics/ Percentiles) is available for full access to all percentiles functions in the EXAMINE procedure, including specification of quartiles or custom percentiles, by using any of the five available estimation methods, and bootstrapped confidence intervals.
Linear Regression
3 new functions are available in the Linear Regression menu (Analyze/ Regression/ Linear):
-
From the Statistics submenu it is possible to select Selection Criteria, which recalls the statistics in the output


2. From the Statistics submenu you can obtain the predicted residual sum of squares (PRESS) statistic, a popular cross-validation-type statistic for assessing linear regression.
3. From Options submenu you can specify the Tolerance keyword level for the criteria subcommand for handling variables exhibiting near collinearity.

Cox Regression
It is available the new Cox w/ Time-Dep Cov dialog box that allows specification/computations of multiple time-dependent covariates for Cox regression models.

New Command syntax
SURVREG RECURRENT
Estimates parametric survival models for recurrent events data via incorporation of a shared frailty term. This term is treated as a random component to account for an unobserved effect due to individual or group-level variability.
MIXED
Adds an OUTFILE subcommand with an EBLUPS keyword to export EBLUPs or random effects parameter predictions to datasets or .sav files. If multiple sets of EBLUPs are requested on RANDOM subcommands via SOLUTION keywords, the FILE_SEPARATE keyword can be used with TRUE or FALSE to save predictions in one or multiple data sets or files.
GENLINMIXED
Adds an EBLUPS keyword to the OUTFILE subcommand to export EBLUPs or random effects parameter predictions to datasets or .sav files. If multiple sets of EBLUPs are requested on RANDOM subcommands via SOLUTION keywords, the FILE_SEPARATE keyword can be used with TRUE or FALSE to save predictions in one or multiple data sets or files.
Version comparison
The main innovations and the comparison between the latest versions are shown below by Statistics for Data Analysis powered by SPSS
